.:. JSpecView Applet Specification
.:. Description
JSpecView is a viewer for spectral data in
the JCAMP-DX format. The
program was developed at the Department of Chemistry of the
University of the West Indies, Mona, Jamaica, WI and is being
released via
 under the GNU
Lesser General Public License.
For a full description see the article published in
Chemistry Central Journal 2007, 1:31 (07Dec2007)
It is written in JAVA and
requires at least JAVA 1.5, although development is currently with 1.6
The code is available under version control (subversion - svn) at
http://jspecview.svn.sourceforge.net/viewvc/jspecview/dev/

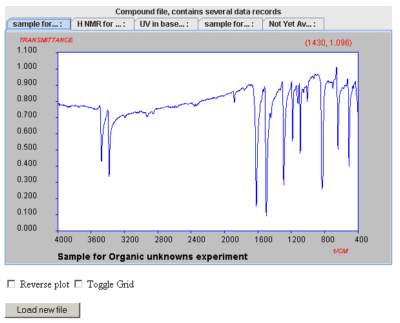
jspecview applet view |

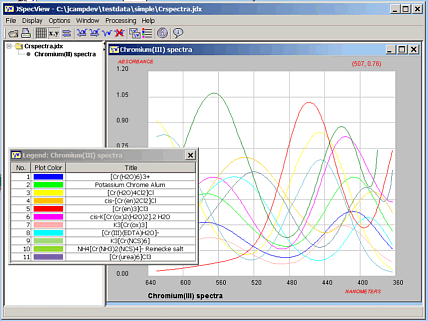
jspecview application view |
.:. Example web pages using JSpecView, for those who can't wait...
Examples of the applet and web page coding:
- sample 1 load JDX and set plotcolor,
- sample 1b import AnIML and set plotcolor,
- sample 1c import CML and set plotcolor,
- sample 1f import JDX and have button to load Inline JDX data,
- sample 2 load BLOCK file with TABS,
- sample 3 load BLOCK file with radio buttons to select a BLOCK
- sample 4 load BLOCK file with all spectra overlaid,
- Signed sample 1 load JDX and allow exports.
The use of JSpecView with MDL Chime, Jmol and Marvin can best be
seen with some examples....
-
IR spectra and displays of vibrational modes
-
GCMS hotlinked chromatograms
-
MS spectra and animations of fragmentations
-
NMR spectra and displays of links to molecular structure
-
Combination of displays
.:. Features
- Load any data file in JCAMP-DX format (with limited support for beta vs 6) as well as
AnIML (protocols still in draft form) and CMLspec files
- Highlight portions of the spectrum
- Many levels of zooming in and out
- Print the Spectrum
- Reverse the plot
- Show a grid
- Show the coordinates as the mouse moves over the plot
- Convert between Absorbance and Transmittance (for UV/Vis and IR)
- Predict the colour of a Visible spectrum
- Integrate H NMR spectra
- Has four possible views or interfaces for compound files:
single, overlay, tab or tile
- View the header or properties of the spectrum
- Java scripting and Live Connect
support *
- Export different JCAMP-DX compression formats *
- Export as AnIML, CML, JPG, PNG or SVG *
* Applets do not normally have permission to write to the hard
disk so these functions will not work unless the appropriate
permissions are set. An example of a signed JSpecView applet is given in
a link to the sample files below. This is not an issue with the standalone application
.:. Parameters
All parameters are passed to the applet as a semi-colon separated
list using a script call.
The accepted parameters in the list and their description
follows:
- load To open a spectrum, the name of the
JCAMP-DX file must be given. Note that the file must be in the
class path of the applet or the full path to the file given.
The forward slash can be used as a path separator '/' or else
escape the backslash using a double backslash '\\'. This
is the only parameter that is required.
for example load filename.dx; or load
c:/jcamp-dx/filename.dx; or load
c:\\jcamp-dx\\filename.dx;
Load is again used for a spectrum stored in
AnIML or CML format. Note that the file must be in the
class path of the applet or the full path to the file given.
for example load filename.aml; or load
c:/XML/filename.xml; or load
c:\\XML\\filename.cml;
- obscure replaces the value of Title by unknown so that
spectra can be displayed as part of on-line quizzes
true or false
- gridon Specifies whether the grid should be
displayed
true or false
- coordinateson Specifies whether the
coordinates should be displayed
true or false
- reverseplot Specifies whether the plot
should be displayed with scale reversed. (This is the reverse of
the order of the points in the file)
true or false
- startindex Used along with endindex
to display only a segment of the spectrum. startindex is
the index of the staring data point of the segment that should be
displayed. If this is specified and endindex isn't then
a segment starting from startindex to the last data
point is displayed.
0,1,2,3...
- endindex the index of the last data point of
the spectrum to be displayed.
for example 32765
- menuon Specifies whether the menus should be
displayed.
If this is set to false then only the
About menu is enabled. This means that
zooming is disabled as well.
To enable zoom, set enablezoom true.
- compoundmenuon Specifies whether the menu
that enables the user to choose which spectrum to display (in
single interface mode) is enabled.
true or false
- enablezoom Specifies whether zooming is
enabled. Enabling zoom effectively enables the zoom menu and vice
versa.
true or false
- spectrumnumber For Ntuple and Block files,
this specifies the spectrum that should be initially displayed
when the applet is loaded.
1,2,3...
- interface This parameter applies to Ntuple
or Block files only. This changes the GUI (Graphical User
Interface) of the applet.
single One spectrum is displayed (default is
spectrum number 1). A Ntuple or Block menu is added to the popup
menu to navigate to the other spectra in the file.
tab All spectra are displayed and may be
navigated with tabs
tile A maximum of 10 spectra are displayed and
tiled. If there are more than 10 spectra in the file then the
interface defaults to single.
overlay The spectra are displayed overlaid.
single, tab, tile, overlay
- coordcallbackfunctionname If this is
provided, the applet calls a javascript function by this name and
passes it the x and y coordinates of the point on the display
that is clicked. Effectively this is a way for the user to
provide an action that is to be carried out when the applet or
certain points on the applet is clicked.
(*) a string, e.g. MyCoordCallBack,
default null
- peakcallbackfunctionname If this is
provided, the applet calls a javascript function by this name and
passes to it not only the x and y coordinates of the point on the
display that is clicked but the closest actual data point and the
spectrumnumber (0 if a single spectrum or the block number if a
compound or Ntuple file). Effectively this is a way for the user
to provide an action that is to be carried out when the applet or
certain points on the applet are clicked.
(*) a string, e.g. MyPeakCallBack,
default null
- titlecolor The color of the title. All
Colors must be specified by an rgb value or as a hexadecimal
value. eg. black would be "0, 0, 0" or "#000000". Note that the #
is required for hexadecimal format and rgb values must be comma
separated.
default is black (#000000)
- gridcolor The color of the grid
default is grey (#808080)
- unitscolorThe color of the units
default is red (#FF0000)
- scalecolor The color of the scale
default is black (#000000)
- coordinatescolor The color of the
coordinates
default is red (#FF0000)
- plotareacolor The color of the plot area
default is white (#FFFFFF)
- plotcolor The color of the plot line
(NB. When spectra are overlaid, the first eight colors are: blue,
green, yellow, orange, red, magenta, pink and cyan. After that
the colors are chosen at random.)
default is blue (#0000FF)
- backgroundcolor The color of the background
default is grey (#808080)
.:. Scripting and Live
Connect
Certain methods in the applet may be called from JavaScript.
These are:
| Method |
Arguments or Return Values |
Description |
| setFilePath |
for example c:/jcamp-dx/filename.dx or
c:\\jcamp-dx\\filename.dx |
Allows the loading of a new JCAMP-DX file, specified from
JavaScript.
Note that the file must be in the class path of the applet or the
full path given.
The forward slash can be used as a path separator '/'
or else escape the backslash using a double backslash '\\'.
|
| loadInline |
string containing JCAMP-DX data |
Allows the loading of inline JCAMP-DX data, specified from
JavaScript string variable.
|
getCoordinate |
returns space separated values, e.g. "3220 0.41". |
Used to return the coordinates of a point when it is clicked
on the applet display
|
| toggleGrid |
none |
Toggles the grid on/off
|
| toggleCoordinate |
none |
Toggles the x,y coordinate display
|
| reversePlot |
none |
Reverses the plot
|
| setSpectrumNumber |
1, 2, ... |
For Ntuple and Block files, this specifies the spectrum that
should be displayed.
|
| addHighlight |
x1 - starting x coordinate
x2 - ending x coordinate
r - red value of rgb color scheme.
Number from 0-255
g - green value
b - blue value
a - alpha value or transparency.
Number from 0 - 255 |
Add a highlight to the region specified by x1 and x2
with the color and transparency specified by r, g, b and a.
|
| removeHighlight |
x1 - starting x coordinate
x2 - ending x coordinate |
Removes the highlight at the position specified by x1 and x2.
There must be a highlight specified by x1 and x2 exactly for this
method to work.
|
| removeAllHighlights |
none |
Removes all highlights from the display.
|
JSpecView may call a JavaScript function in response to mouse
clicks in the plot area of the spectrum display if the
coordcallbackfunctionname parameter (*) is specified. This function gets passed
the values of the x and y position as two floating point numbers.
Therefore, a JavaScript function must be implemented with the
name given by coordcallbackfunctionname and take
as its argument two floating point values for the x and y
coordinates. Eg. if the value of the
coordcallbackfunctionname parameter is
onCoordClicked then a JavaScript method might look
like this..
function onCoordClicked(x, y){


    alert("You Clicked: " + x + ", " + y);


}
Similarly JSpecView may call a JavaScript function in response
to mouse clicks in the plot area of the spectrum display if the
peakcallbackfunctionname parameter is specified.
As with the coordcallback function this gets passed the values of
the x and y position as two floating point numbers. In addition
though it returns the closest actual X,Y values from the dataset
and the value of the spectrum number if a Block or Ntuple file is
open. Therefore, a JavaScript function must be implemented with
the name given by peakcallbackfunctionname and
take as its argument four floating point values for the two sets
of x and y coordinates and an integer for the spectrum number.
Eg. if the value of the peakcallbackfunctionname
parameter is MyPeakClicked then a JavaScript method
might look like this..
function MyPeakClicked(x1, y2, x2, y2, SNum){


    alert("You Clicked: " + x1 + ", " + y1);


    alert("The nearest datapoint was at : " +
x2 + ", " + y2);


}
Check the
JSpecView sourceforge project page for the last announcements
and
sign up for the users mailing list to get further information and
contribute to the discussion.
To download the jar files or source code, visit the Sourceforge Subversion
Pages.
Copyright © 2006-2009 by The University of the
West Indies, all rights reserved.
Created 1st March 2006. Links checked and/or
last modified 11th March 2009.
For further information contact Prof. R.J.
Lancashire, Department of Chemistry, UWI, Mona, Kingston 7,
JAMAICA, ([email protected])
under the GNU
Lesser General Public License.
For a full description see the article published in
Chemistry Central Journal 2007, 1:31 (07Dec2007)

